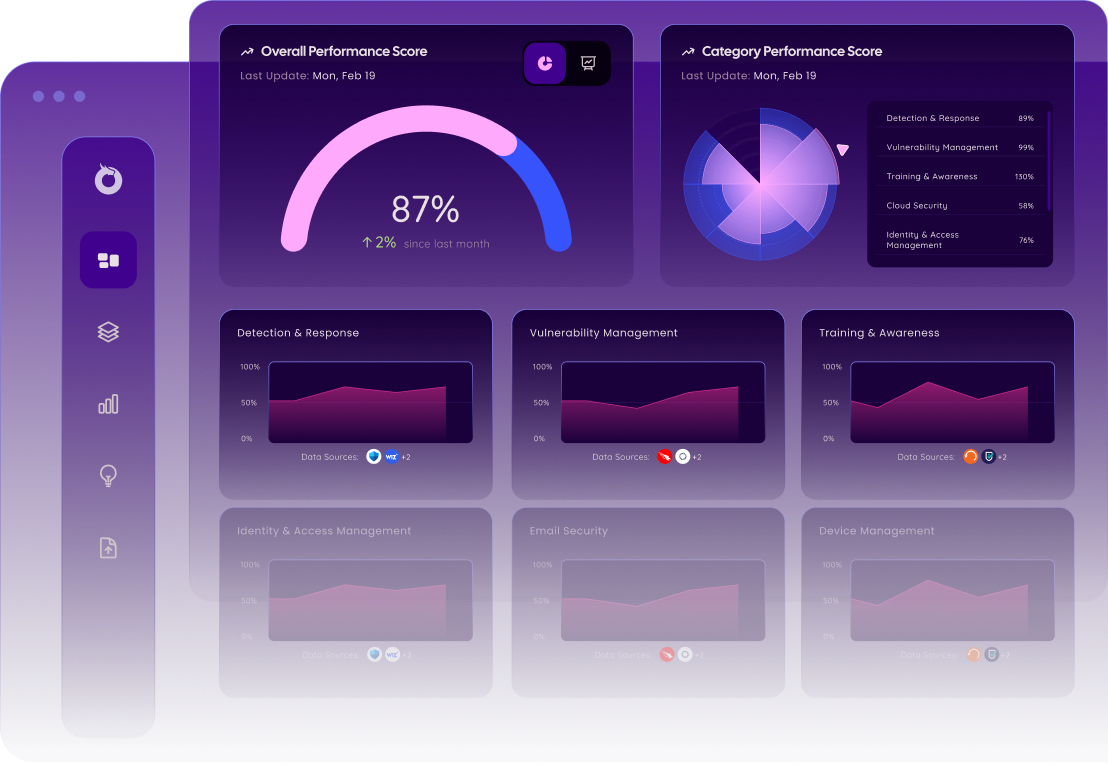
Ensure Every Asset in Your Organization is Fully Covered
With Onyxia’s Asset Coverage Analyzer, you can instantly compare device coverage between your security solutions and measure how many devices require your team's attention.
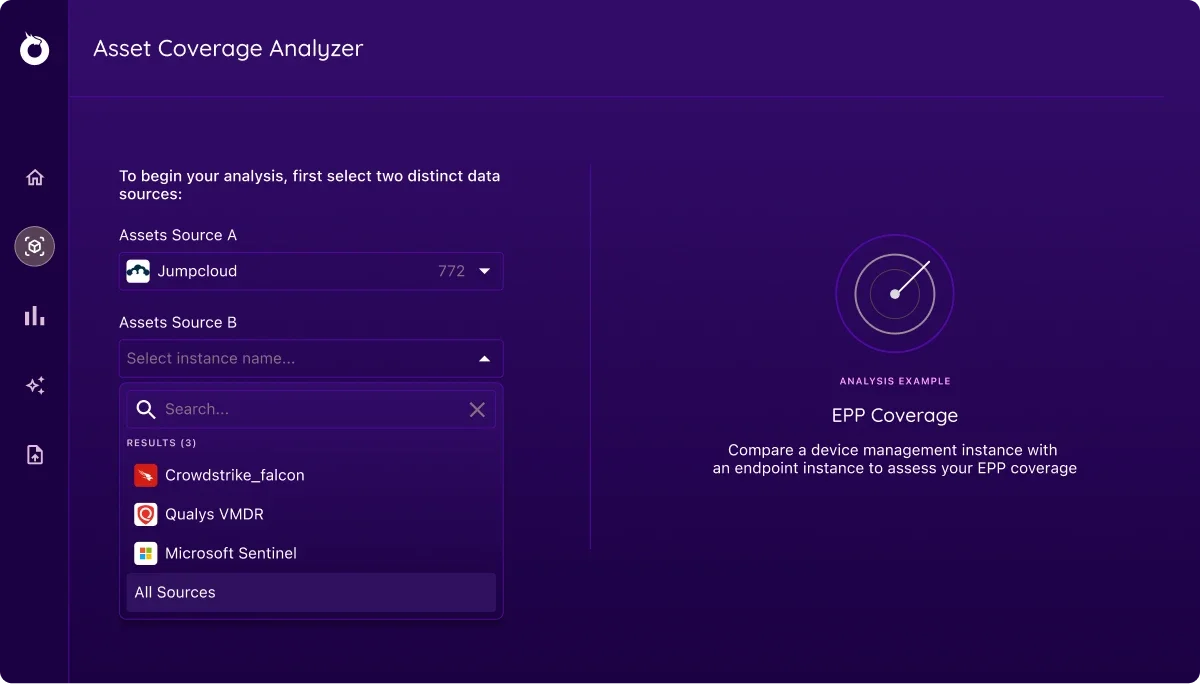
Quickly Identify Gaps in Coverage
The Onyxia Asset Coverage Analyzer allows you to measure the number of connected devices covered by two different device management solutions in real-time. This allows you to easily track and identify the devices that must be updated to meet your organization’s compliance policies.
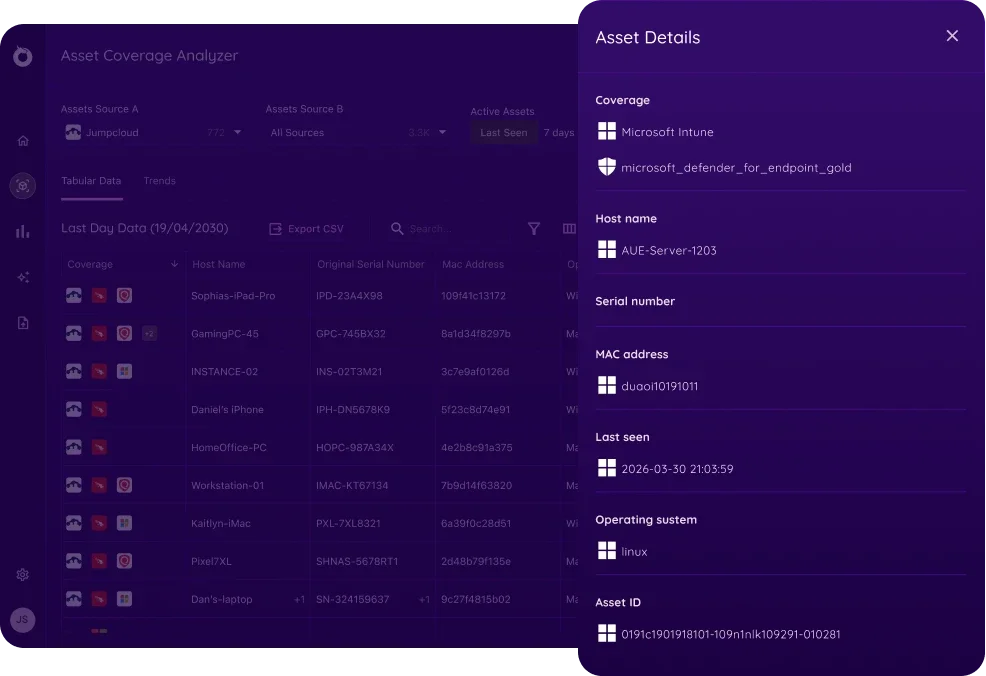
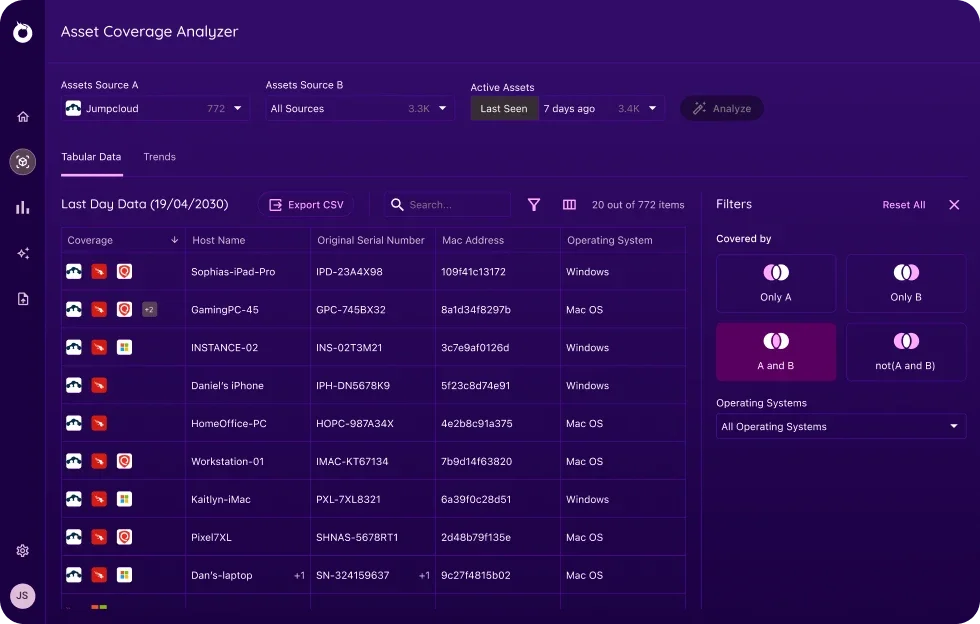
To make it easier to pinpoint a specific set of devices, the Onyxia Asset Coverage Analyzer results can be filtered by Operating System, Last Seen On Network, and Date Range. This will allow you to create a more targeted search and find devices based on specific criteria.
Locate Devices
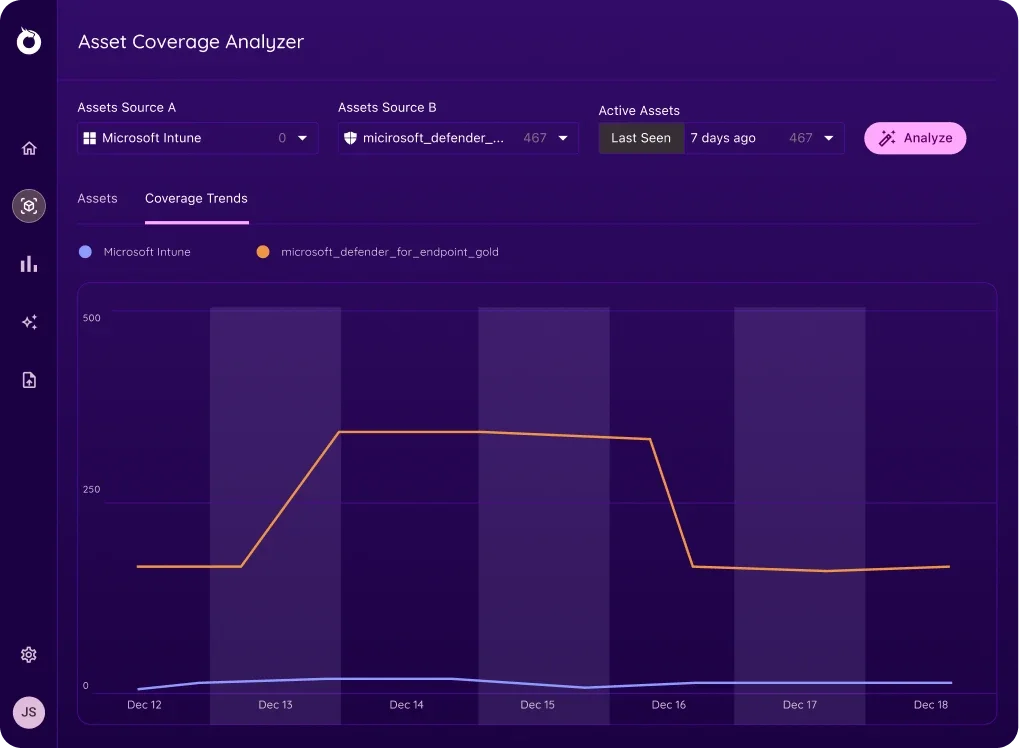
Highlight the Impact of Your Device Management
The Asset Coverage Analyzer timeline view allows you to easily communicate the efforts of your team and the value of your security program. By showing a linear count of device coverage over time, you can quickly assess the performance of and quantify your device management initiatives.
Why Does Analyzing Asset Coverage Matter?

Enhanced Exposure Management
Add another level to your program assessment with asset coverage data. Identify potential vulnerabilities and optimize your training and awareness processes.

Apply Your Budget Decisions
Get the most out of your security stack. Ensure your security products are being utilized properly, measure gaps, and identify redundancy.

Maintain Organization Compliance
Using the Asset Coverage Analyzer, track that your security program remains compliant with your organizational goals and SLAs.
Analyze and Optimize The Coverage of Your Device Management Solutions